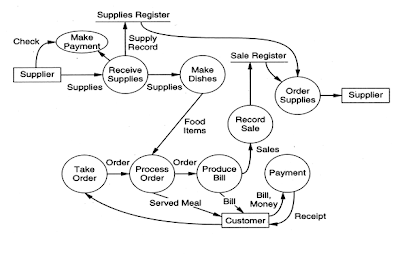
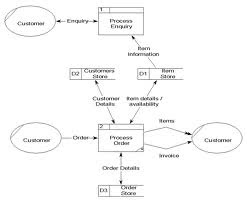
Having a DFD Inventory Management System will make the collaboration easy because the end users will be able to visualize the operation of the system, theee will see a better perspective what the flow will accomplish and how the whole project will be implemented. A project implementation can also be made more efficient especially in progress monitoring. The DFD of the old drawing can be laid side by side with the new one so that comparisons can be made and weak points can be identified so that the appropriate innovations can be developed.
Example of DFD Inventory Management System drawing
Data flow diagrams are used to describe how the system transforms information and can be used to provide the end user with a physical idea of where the data they input ultimately has an effect upon the structure. They define how information is processed and stored and identify how the information flows through the processes. There are two approaches to developing a DFD. The first approach is the Top Down Approach where a DFD starts with a context level DVD and then the system is slowly decomposed until the graphical detail goes down to a primitive level. On the context diagram the system's interactions with the outside world are modeled purely in terms of data flows crossing. The context diagram shows the entire system as a single process, and gives no clues as to its internal organization.
When building a data flow diagram, the following items should be considered:
1. where does the data that passes through the system come from and where does it go,
2. what happens to the data once it enters the system (i.e., the inputs) and before it leaves the system (i.e., the outputs),
3. what delays occur between the inputs and outputs (i.e., identifying the need for data stores).
The context-level DFD is next "exploded", to produce a Level 0 DFD that shows some of the detail of the system being modeled. The Level 0 DFD shows how the system is divided into sub-systems (processes), each of which deals with one or more of the data flows to or from an external agent, and which together provide all of the functionality of the system as a whole. It also identifies internal data stores that must be present in order for the system to do its job, and shows the flow of data between the various parts of the system.
The other approach, Event Partitioning Approach just Enough Structured Analysis. In Event Partitioning Approach, a detailed DFD is constructed all events are made. For every event, a process is constructed and then each process is linked with other processes through data stores. Each process' reaction to a given event is modeled by an outgoing data flow, users are able to visualize how the system will operate, what the system will accomplish, and how the system will be implemented from order to dispatch to report.
STEPS TO DRAW A DATA FLOW DIAGRAM
1. Start from the context diagram. Identify the parent process and the external entities with their net inputs and outputs.
2. Place the external entities on the diagram. Draw the boundary.
3. Identify the data flows needed to generate the net inputs and outputs to the external entities.
4. Identify the business processes to perform the work needed to generate the input and output data flows.
5. Connect the data flows from the external entities to the processes.
6. Identify the data stores.
7. Connect the processes and data stores with data flows.
8. Apply the Process Model Paradigm to verify that the diagram addresses the processing needs of all external entities.
9. Apply the External Control Paradigm to further validate that the flows to the external entities are correct.
10. Continue to decompose to the nth level DFD. Draw all DFDs at one level before moving to the next level of decomposing detail. You should decompose horizontally first to a sufficient nth level to ensure that the processes are partitioned correctly; then you can begin to decompose vertically.
How to Draw DFD Inventory Management System Tips and Hints
1. Consider creating a data access model to document the processes that create, update, and delete data in the system.
2. As an alternative to functional decomposition, consider using a bottom-up approach when the details about the system are well known.
3. When analyzing the business system under study in terms of its response to events (for example, user interaction with windowed systems), consider the following:
There many DFD tools available in the market today. Some of these DFD tools include Microsoft Visio, ConceptDraw, Dia, SmartDraw and SILVERRUN ModelSphere. Most of these tools have drag and drop capabilities and have analysis tools to help a designer see instant potential flaw in the diagram so correction can done immediately.


